Bottleneck Scan Window
Bottleneck Scan Window is where you’ll be spending most of your time. It’s where you’ll be running tests and have reports listed.
Running Tests
To access Bottleneck Scan, go to Window > Project Scan > Bottleneck Scanner
![]()
Now, if you’re opening this Window for the first time, you’ll have 0 “Potential performance Bottlenecks”. From there, press Run Tests. It should take several seconds for it to produce results. Scan time depends on your project size. The larger the project the more time it takes for scanning to finish. It’s recommended to make use of Filters and run only specific tests.
Side Panel
Located on the left side of the window, the side panel lists all available test categories to you. You can enable or disable them if you prefer to run only specific tests.
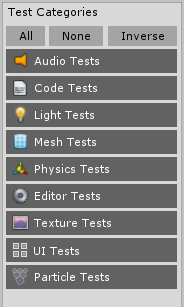
| All | Selects all tests from Test Categories. |
|---|---|
| None | Deselects all tests from Test Categories. Will produce zero results if run. |
| Inverse | Toggles all tests from Test Categories. Enabled tests will become disabled while disabled tests will be enabled. |
Top Panel
Top panel, which is located at the top of the window, is responsible for manipulating how scan results are presented to you. From there, you can sort, filter out, or dismiss results.

| Show Filters | Shows/hides all available filters. Filters of the specific category will be hidden if there are no results for given category. |
|---|---|
| Show Default/Show Dismissed | A drop-down that allows you to switch between Default (Normal) and Dismissed results. |
| Dismiss Selected | Dismisses selected results. Displayed only when at least one result is selected. |
| Sort By Results ID | Sorts all results by their identification number in ascending order. |
| Sort By Category | Sorts all results by their categories. |
| Sort By Affected Objects | Sorts all results by the number of affected objects in descending order. |
| Gear Icon | Located in the far-right corner of the panel, the gear icon opens Bottleneck Settings window. |
Result Cards
That’s the heart of Bottleneck Scanner. It lists all Results in a card-like format, giving you an insight of a problem and how can it be solved.
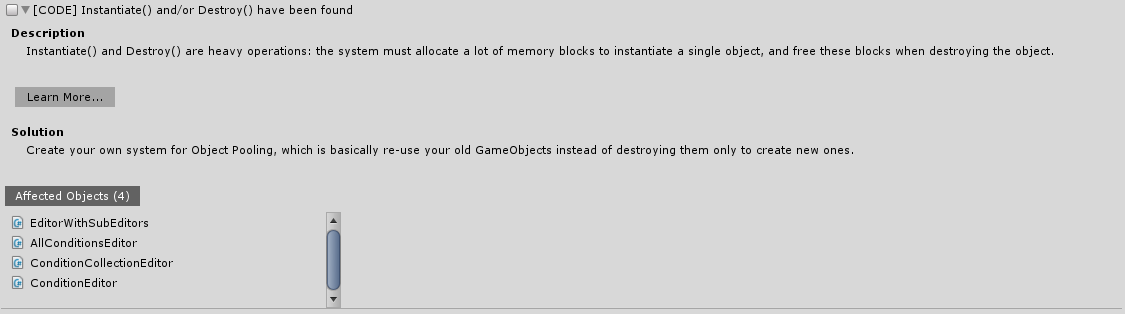
| Header | Header gives you a brief description of the problem that it has found. If enabled, it tells you which category does this result belongs to (enclosed in brackets). |
|---|---|
| Learn More… | Opens a relevant article in your default web browser. |
| Description | Gives you a more detailed overview of a problem and what are consequences of not fixing such problem. |
| Solution | Provides an explanation of how the problem can be fixed. |
Affected Objects

Affected Objects show which Assets/GameObjects/Folders are affected by a said problem. If many scenes are open, Affected Objects will be organized by their source scene.
Clicking an item from Affected Objects will display its properties in Inspector Window. It will also “ping” an item in either Project Window or Scene Hierarchy.
You can also multi-select Affected Objects, allowing you to edit settings of multiple objects simultaneously. Multi-select behaves in the same fashion as if you’re selecting assets in a Project Window or Hierarchy Panel.
- To multi-select, click an item while holding down CTRL (CMD on Mac).
- To deselect an item, CTRL/CMD + Click it.
- If Affected Object is an Asset or a Folder you have access to the context menu.
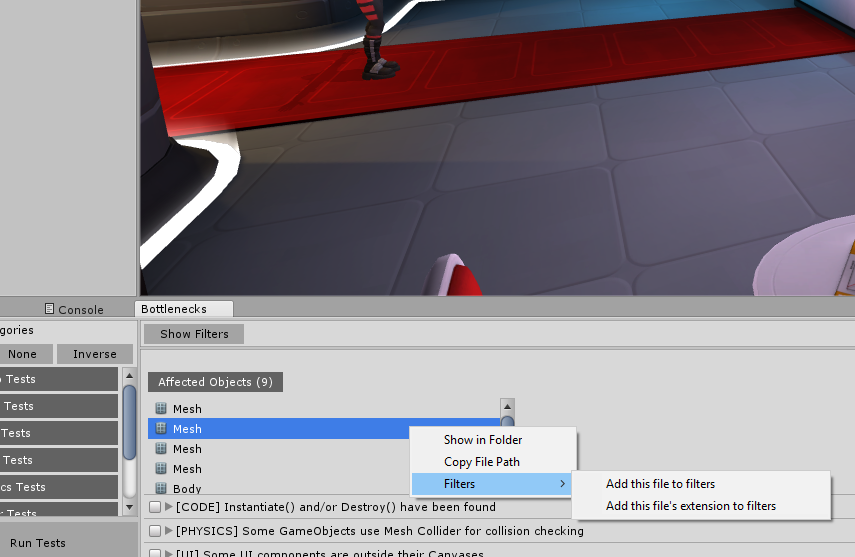
| Show in Folder | Opens File Explorer (or Finder in Mac OS) and shows where said object is located. |
|---|---|
| Copy File Path | Copies object’s file path to clipboard. |
| Filters | Access options to quickly ignore either this file or its extension. |